by
Bhaskar Chakravorti &
Ravi Shankar Chaturvedi*
In Chicago, for example, predictive analytics is improving health inspections schedules in restaurants, while in Boston city officials are collaborating with Waze, the traffic navigation app company, combining its data with inputs from street cameras and sensors to improve road conditions across the city. A city-state such as Singapore has a more holistic idea of a “smart nation,” where the vision includes initiatives from self-driving vehicles to cashless and contactless payments, robotics and assistive technologies, data-empowered urban environments, and technology-enabled homes.
More broadly, we might define a smart society as one where digital technology, thoughtfully deployed by governments, can improve on three broad outcomes: the well-being of citizens, the strength of the economy, and the effectiveness of institutions.
The potential for technologies to enable smart societies is rising. For example, internet-of-things sensor applications are envisioned to deliver a wide range of services, from smart water to industrial controls to e-health. The market for smart technologies is predicted to be worth up to $1.6 trillion by 2020, and $3.5 trillion by 2026. Surely, given the size of the opportunity, increasing interest among governments and policy makers, and the explosion of relevant technologies, we can start to understand what smart societies are and establish standards and ideals to aim for.
The Fletcher School at Tufts University and Microsoft Digital have launched an initiative to explore this issue, with several questions as the guiding framework:
-What are smart societies, and what are their core components?
-Are there countries that might offer realistic models for such societies?
-Are there patterns of different approaches to smartness reflecting different contexts, histories and societal priorities?
What are the implications for policy makers, particularly as they consider digital technology — whose applications are growing at an accelerated pace — as a lever for getting to smartness?
To answer these questions, we began with a simple premise: Neither “smartness” nor the technology to be deployed is the end goal. A smart society ought to be defined by a framework that is based on outcomes. Its building blocks are what governments and policy makers aim to provide for their citizens. The technology is just a way to get there.
The next step was to identify potential models for smart societies. A natural group of countries to use as role models was the Digital 5, or D5, nations, representing the most digitally advanced governments in the world. The group comprises Estonia, Israel, New Zealand, South Korea, and the UK. Their objective, as set out by the D5 charter, is to provide the best digital public services and to share practices across these high-performing digital governments. There is a plan to admit more countries to this group as it establishes practices that can benefit countries from across the world.
To set an aspirational but realistic target, we created a benchmark that combines the best attributes of these advanced digital nations. Our hope is that it serves several purposes. First, it sets a standard for policy makers based on what has been demonstrated to be feasible by at least one of the D5 nations. Second, with the benchmark as a composite, no single nation achieves it and yet each of the five countries’ progress toward the ideal can be assessed in terms of performance against the benchmark. If any country intends to close a gap, it can turn to the others to learn about best practices and import knowledge that could help it get to the benchmark. The benchmark, therefore, is a tool for policy makers, technology innovators, and others to evaluate progress and prioritize the gaps, thus enabling a dialogue among the key actors and a plan for action.
Methodology
We collected data on the D5 countries on over 240 different indicators, covering three major areas: citizens and their well-being, the economy, and the state of institutions. Over 40 data sources were used, including public and proprietary databases. Each country was given a score for its performance on each indicator; we used the best score for each indicator to create the Smart Societies Benchmark. Given the large number of indicators analyzed, we organized them so that each indicator could be classified under one of 12 broad benchmark components. These broad components were:
Citizens/People Components: the four components in this category are:
-inclusivity,
-environment and quality of life,
-state of talent and the human condition,
-talent development.
-Economy Components: the four components in this category are:
-global connectedness,
-economic robustness,
-entrepreneurial ecosystem,
-innovation capacity.
Institutions Components: the four components in this category are:
-freedoms offline and online,
-trust,
-safety and security,
-public services.
Each component is made up of different clusters of indicators. As an example, consider the first component listed above: inclusivity. The score assigned to this component is an aggregate of scores earned by different clusters of inclusion-related indicators; the clusters that make up inclusivity are labor market inclusion, economic mobility, diversity and acceptance, and policies that promote inclusion.
In turn, the “policies that promote inclusion” cluster includes indicators such as data on policies, laws, and regulations that promote access for marginalized or disadvantaged groups. As observed above, each D5 country gets a score along each indicator. Thus, the benchmark score for the Inclusivity component is the aggregate of the top scores for each indicator within this broad benchmark component. The scores for each component were normalized.
In turn, the “policies that promote inclusion” cluster includes indicators such as data on policies, laws, and regulations that promote access for marginalized or disadvantaged groups. As observed above, each D5 country gets a score along each indicator. Thus, the benchmark score for the Inclusivity component is the aggregate of the top scores for each indicator within this broad benchmark component. The scores for each component were normalized.
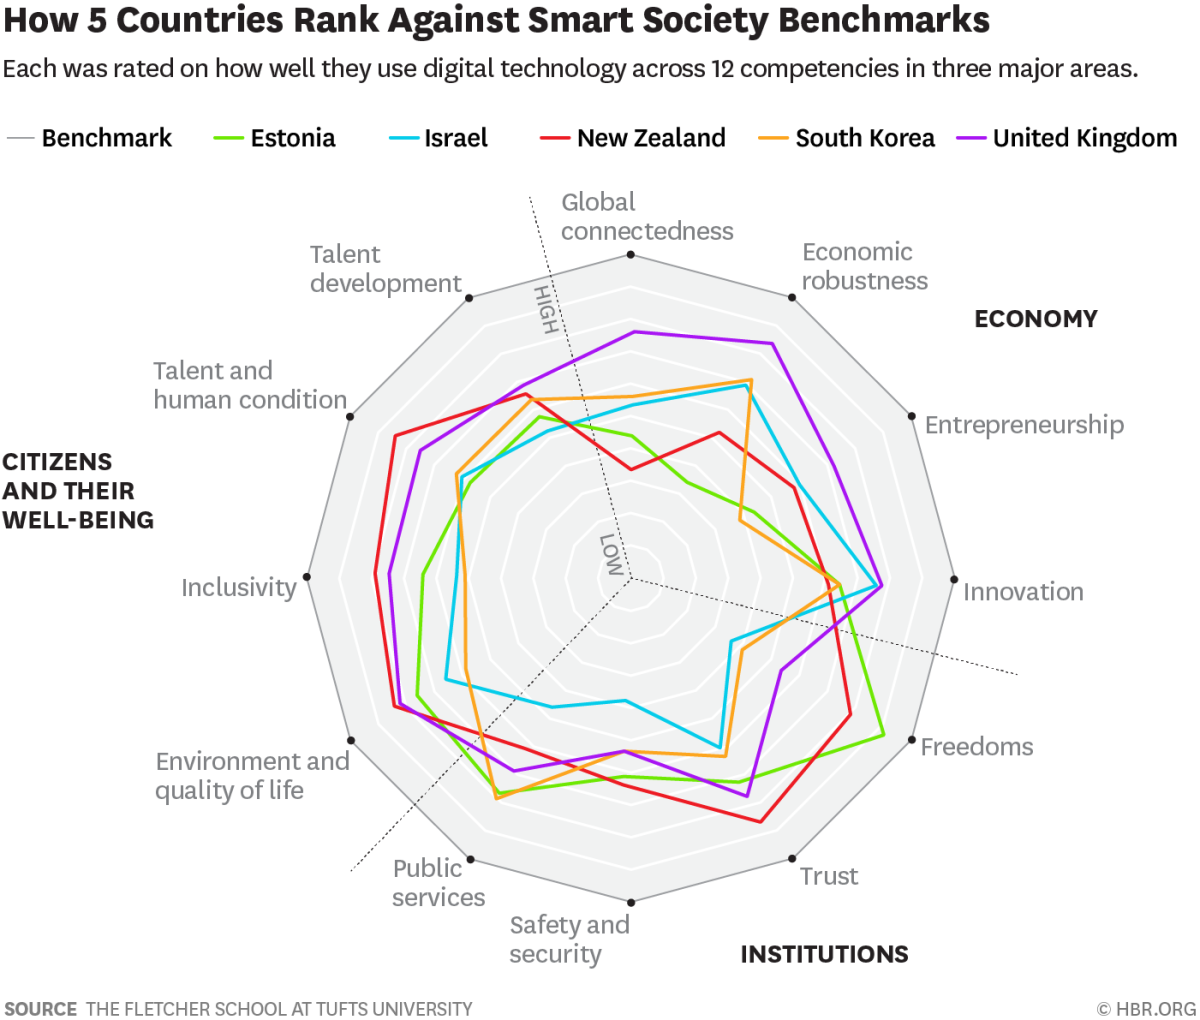
Finally, each of the D5 countries was scored along these indicators, and the resulting country score was compared with the benchmark to evaluate each country’s progress and to derive patterns and differences in priorities. Collectively, the D5 nations serve two important purposes for our project: They give us a way to construct a global benchmark that can be used to assess D5 nations and other countries, and they each offer a case study and model for what smart can look like.
The outcomes of this exercise are shown in the exhibits below. Higher scores along each of the 12 components are represented by the distance from the center. The line connecting each country’s component scores across all 12 components is its “Smart Society Footprint.”
There are several implications that flow from this analysis.
The D5 nations constitute an extraordinary group, with the world’s most digitally advanced governments, and collectively they help us define a global benchmark for a smart society. The benchmark is aspirational and yet feasible.
The D5 nations share several characteristics, even as they offer role models for different types of smart societies. Each has a democratically elected government that plays an active role in offering services to its citizenry. Each is a highly evolved digital player. As reported in our recentHBR article “60 Countries’ Digital Competitiveness, Indexed,”each scored highly on our Digital Evolution Index; with the exception of South Korea, each is also in a state of high digital momentum. Yet each also has a unique context.
Consider some of the key differences:
Estonia is an outlier. It is a small country, formed out of the breakup of the Soviet Union. It used technology to build out its government services and embrace a market economy.
Despite their historical associations, the UK and New Zealand are at extreme ends of the connectivity spectrum. The UK is often identified as a global hub (a position that is going to be tested during the Brexit process), with strong global economic and political connections; New Zealand is geographically distant from much of the economic and political centers of the world, and is used to operating at the periphery of the global economy.
Both Israel and South Korea have escaped the“middle-income trap”, successfully transitioning from middle-income to high-income status – a relatively rare feat. They both are key players in the global economy today, have great geopolitical significance, and are strong U.S. allies. Israel is mostly surrounded by hostile neighbors in a politically tense region. South Korea resides in a different politically tense region, in North Asia, with an active threatof conflict with its nuclear-armed neighbor, North Korea, and the added tensions created by China’s growing dominance.
We asked Colin MacDonald, Chair of the D5 and the New Zealand’s Government Chief Digital Officer, about the differences between the D5 countries. He said: “Although we all bring a diverse range of perspectives, the D5 allows us to leverage the knowledge and experience of our smartest people, creating faster and more efficient digital governments for our citizens. We do this through collaboration and sharing. We all learn from one another, and adopt the solutions that will work in our own countries. Ultimately, this makes us all stronger as digital nations.”
The Smart Societies Footprint analysis reveals that each D5 nation is an archetype of a distinct model of “smartness,” which reflects a combination of the country’s context and priorities. In a world with limited resources, the ability to prioritize and identify areas of focus and particular form of smartness that fits with each country’s circumstances can prove to be essential. Here are some of the distinct patterns, which offer models for other countries to use.
Strong Institutions Footprint: Estonia’s footprint reveals its initial priorities on establishing strong institutions, particularly in its commitment to assuring post-Soviet era freedoms to its citizens. Its e-solutions have resulted in high levels of government transparency and easy access to data and public services. Its priorities on creating an open and decentralized system that links multiple digital applications and services are core to how it accomplished these outcomes. Its key gap areas as revealed by its distance from the benchmark are in establishing greater connectedness and robustness of its economy. Given its heavy investment in digital infrastructure, the government can leverage this foundation to narrow the gaps.
Strong Innovation Footprint: Israel demonstrates strength in the area of innovation, while its greatest opportunities for closing gaps are in the area of strengthening institutions. In addition to the technology-related innovations that are a product of Israel’s investment in its national security infrastructure, a major government plan, the Digital Israel initiative, with its emphasis on high-speed internet connectivity, has been a boon for businesses looking to operate online. The country can utilize the same technological platforms for improving public services and improving the state of interaction between the government and its people – which our analysis has identified as being among the gaps that need to be narrowed.
Strong Well-Being Footprint: New Zealand offers a case study in strengths in the components that ensure well-being of a country’s people, including the environment and quality of life, inclusivity, and the state of its talent base. Here, policy makers view digital government as one where digital technology is a tool for governments to interact with its “customers” — citizens and businesses — so that they can experience public services in a seamless, integrated, and trusted manner.
Given its physical distance from much of the world, New Zealand has some inherent challenges in narrowing the gap in its global connectedness; its investment in a seamless digital ecosystem to enhance the well-being of its people and the quality of its institutions indicates a focus on areas where it can compensate for its physical distance, and also attract and retain talent to narrow the gaps in the areas of innovation and entrepreneurship.
Strong Public Services Footprint: South Korea has utilized a digital initiative, Government 3.0, to provide personalized public services. One of the key areas where the government needs to narrow the gap is in the robustness of the economy and the quality of its institutions. The Government 3.0 initiative is potentially a powerful lever in advancing such an objective through several means: ensuring greater transparency and providing more data on the workings of public agencies, encouraging more cross-agency collaborations, and helping people find jobs and economic opportunities more readily.
Strong Economy Footprint: Historically, the UK has been one of the world’s most significant economies. It is the fifth largest in terms of GDP, and is one of the most globally connected of all major economies. It has historically been the preeminent hub for global finance because of a combination of history, geography, and its strengths in digital technologies. As one of the authors of this article (Chakravorti) has observed earlier in HBR, “Would a Hard Brexit Cripple the EU’s Digital Economy?” the UK is a star performer among EU digital economies.
These strengths show in the benchmarking analyses above. The conundrum for the UK is that, with Brexit, it runs the risk of diminishing its economic strengths. Already, since the Brexit referendum, it has been the worst-performing advanced economy in terms of growth; its currency has lost more than 13% of its value against the dollar because of the uncertainties caused by Brexit. In order to compensate for the turbulence ahead for the economy, it is essential for the government to use tools at its disposal to shore up the other aspects of society. Here the UK’s Government Transformation Strategy 2017-2020 and “Government as a Platform” approaches help provide first-rate digital services to grow talent, improve workplace conditions, and help transformations through shared platforms and data.
These strengths show in the benchmarking analyses above. The conundrum for the UK is that, with Brexit, it runs the risk of diminishing its economic strengths. Already, since the Brexit referendum, it has been the worst-performing advanced economy in terms of growth; its currency has lost more than 13% of its value against the dollar because of the uncertainties caused by Brexit. In order to compensate for the turbulence ahead for the economy, it is essential for the government to use tools at its disposal to shore up the other aspects of society. Here the UK’s Government Transformation Strategy 2017-2020 and “Government as a Platform” approaches help provide first-rate digital services to grow talent, improve workplace conditions, and help transformations through shared platforms and data.
These case studies suggest that before we can take advantage of the ways in which smart technology can strengthen economies, make institutions more effective, and improve citizens’ well-being, we need to bring the idea of a “smart society” down to earth, defining it in ways that are practical, actionable, and focused on outcomes. Benchmarking can help governments better understand their current capabilities.
Of course, it’s quite possible that one day all smart societies will be traversed by flying cars and lighted by streetlights that communicate with each other. In the meantime, we can get societies to be a whole lot smarter by making better use of the technology we have at hand. As the footprints of the world’s most digitally advanced governments indicate, even the best-positioned nations have some gaps to close. And those gaps, and the technologies to close them, vary according to every country’s unique context and priorities.
The authors are grateful to James Bolitho, Jessica Sashihara, Caroline Troein and Bradley Waddell from The Fletcher School, Russell Craig, Bruce Johnson, Rimes Mortimer, Brigitte Reuland, Ramesh Siva and Tyson Storch from Microsoft Digital, Emma MacDonald, Tim Occleshaw and Graeme Osborne from the NZ Government, and Colin MacDonald, Chair of the D5, for their valuable inputs, advice and contributions to the analyses.
*Bhaskar Chakravorti, Senior Associate Dean, International Business & Finance at The Fletcher School, Tufts University. Ravi Shankar Chaturvedi, Research Fellow, Tufts University
**First published in www.weforum.org
![]() in collaboration with the Harvard Business Review.
in collaboration with the Harvard Business Review.
 By: N. Peter Kramer