Can we design business hierarchies that work, but also ones that we like? The results of our recent reader survey suggest that the key is finding a way to flatten organisations without sacrificing effectiveness.
In our efforts to understand what we dislike about hierarchies, a few weeks ago we asked readers to take a short, anonymous survey about the shape of their organisation’s hierarchies. We are delighted to report that we received 246 responses from organisations in six different, major sectors, whose primary activities were located all around the world.
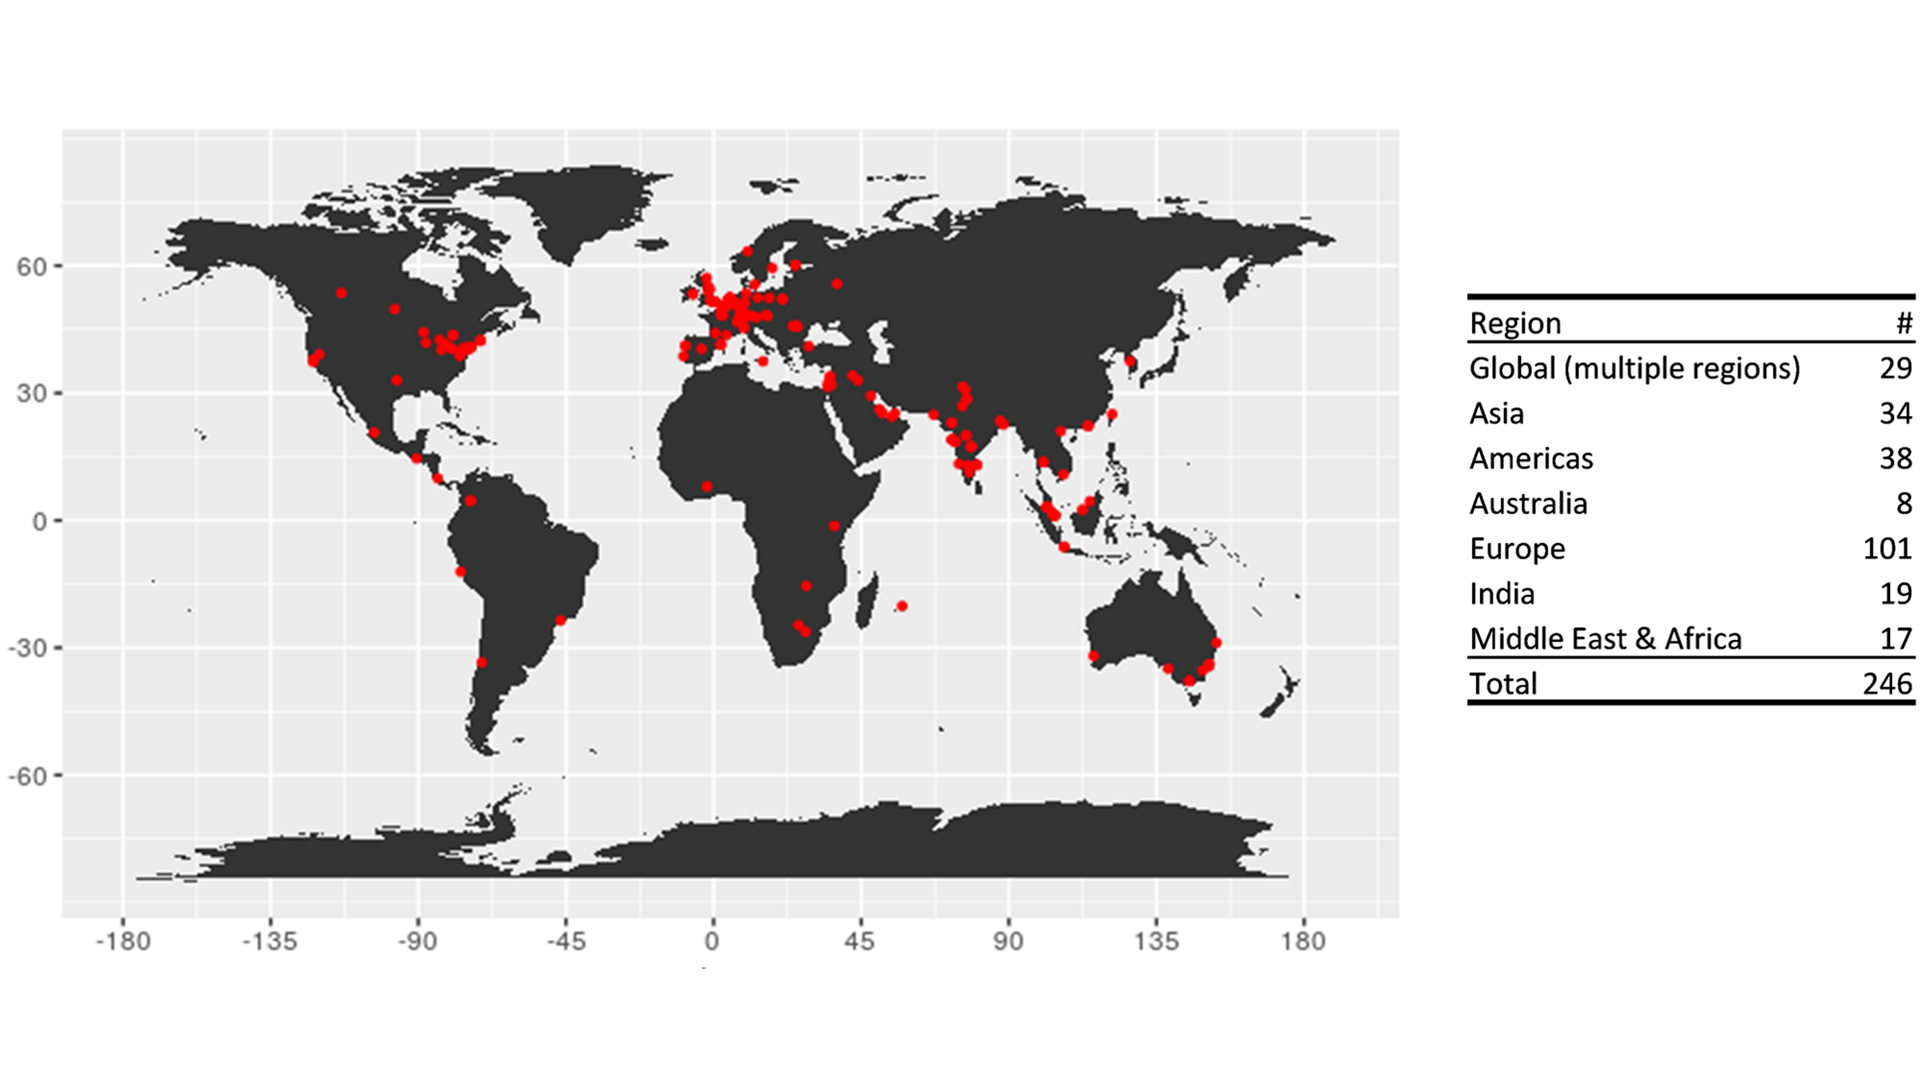
The respondents themselves (based on their IP addresses) were located across multiple regions (see Figure 4) and were drawn from the upper ranks of their organisations. The organisations represented in the sample varied enormously in size and age. They also varied greatly in the number of layers in the hierarchy (from 1 to 33). By layers, we mean the number of bosses that stand between the most junior employee and the CEO. Figure 1 shows average layers for organisations in different size categories.
The respondents themselves (based on their IP addresses) were located across multiple regions (see Figure 4) and were drawn from the upper ranks of their organisations. The organisations represented in the sample varied enormously in size and age. They also varied greatly in the number of layers in the hierarchy (from 1 to 33). By layers, we mean the number of bosses that stand between the most junior employee and the CEO. Figure 1 shows average layers for organisations in different size categories.
We learned that the shape of hierarchies varies tremendously across organisations. But perhaps the much more surprising insight was about how it varies within an institution.
Organisational hierarchies: Christmas trees, not pyramids
Most current implicit and explicit thinking about hierarchies within organisations assumes that the span of control at any layer is constant. Our span of control is the number of direct subordinates that a boss has. We had strongly suspected that the assumption of a constant span is not correct, and the data strongly bears this out. Only 12 percent of respondents told us that the span in their organisations remained constant across layers (see Figure 2).
The majority (39 percent) felt that there was no systematic pattern to the relationship between span and layers, and the rest were distributed into those who said span increased vs. those who said it decreased across layers within their organisations. This means that organisational hierarchies are, in truth, more like Christmas trees than pyramids, with the spans varying quite a bit at different layers of the hierarchy.
The majority (39 percent) felt that there was no systematic pattern to the relationship between span and layers, and the rest were distributed into those who said span increased vs. those who said it decreased across layers within their organisations. This means that organisational hierarchies are, in truth, more like Christmas trees than pyramids, with the spans varying quite a bit at different layers of the hierarchy.
Why does this matter? The span of control of one’s superiors in a hierarchy is known to be strongly associated (positively) with the sense of autonomy an individual enjoys, and with the sense of proximity to the ultimate locus of power. The classics in organisation design (e.g. Urwick, Mintzberg) have noted that larger spans necessarily imply less time spent supervising each subordinate, giving each employee a greater sense of freedom from interference from their superiors. (This will not necessarily lead to an effective outcome, but here we are focusing on perceptions of autonomy.) Larger spans also imply fewer layers, shortening the distance to the apex.
Large variations in the span of one’s superiors can therefore imply that individuals at different levels within the same hierarchy may report very different levels of satisfaction with their experience of the hierarchy. And this need not follow any systematic pattern as we move up and down the layers of a hierarchy. Satisfaction with the hierarchy is probably uncorrelated with levels, except at the very top and the very bottom.
How to delayer?
We also asked survey respondents what change they would make to their hierarchy’s shape, keeping the size the same. 29.2 percent said they would decrease layers and 21.5 percent said they would increase span. These are perfectly equivalent, of course: For a given number of employees, the only way to decrease layers in the hierarchy is to increase span, or vice versa. A third said they would do neither. In response to open-ended questions, 12 percent also emphasised delayering, while another 16 percent and 12 percent asked for more delegation and peer-to-peer interactions, respectively. The overall message seems clear: The inhabitants of hierarchies would like them to be flatter, with smaller power differences between the apex and lower layers.
As far as we know today, there are only two ways to delayer an organisation: Either shrink organisations, so that with a given span, the hierarchy will have fewer layers as the number of members in the organisation contracts; or keep the same number of members but increase spans of control.
So how can we increase spans of control without sacrificing effectiveness? Alternately, can we diminish power distances and enhance autonomy without changing layers (or sacrificing effectiveness)? This will be the topic of our last post in this series, which will be published soon.
Figure 1.
a. Average number of layers by organization size
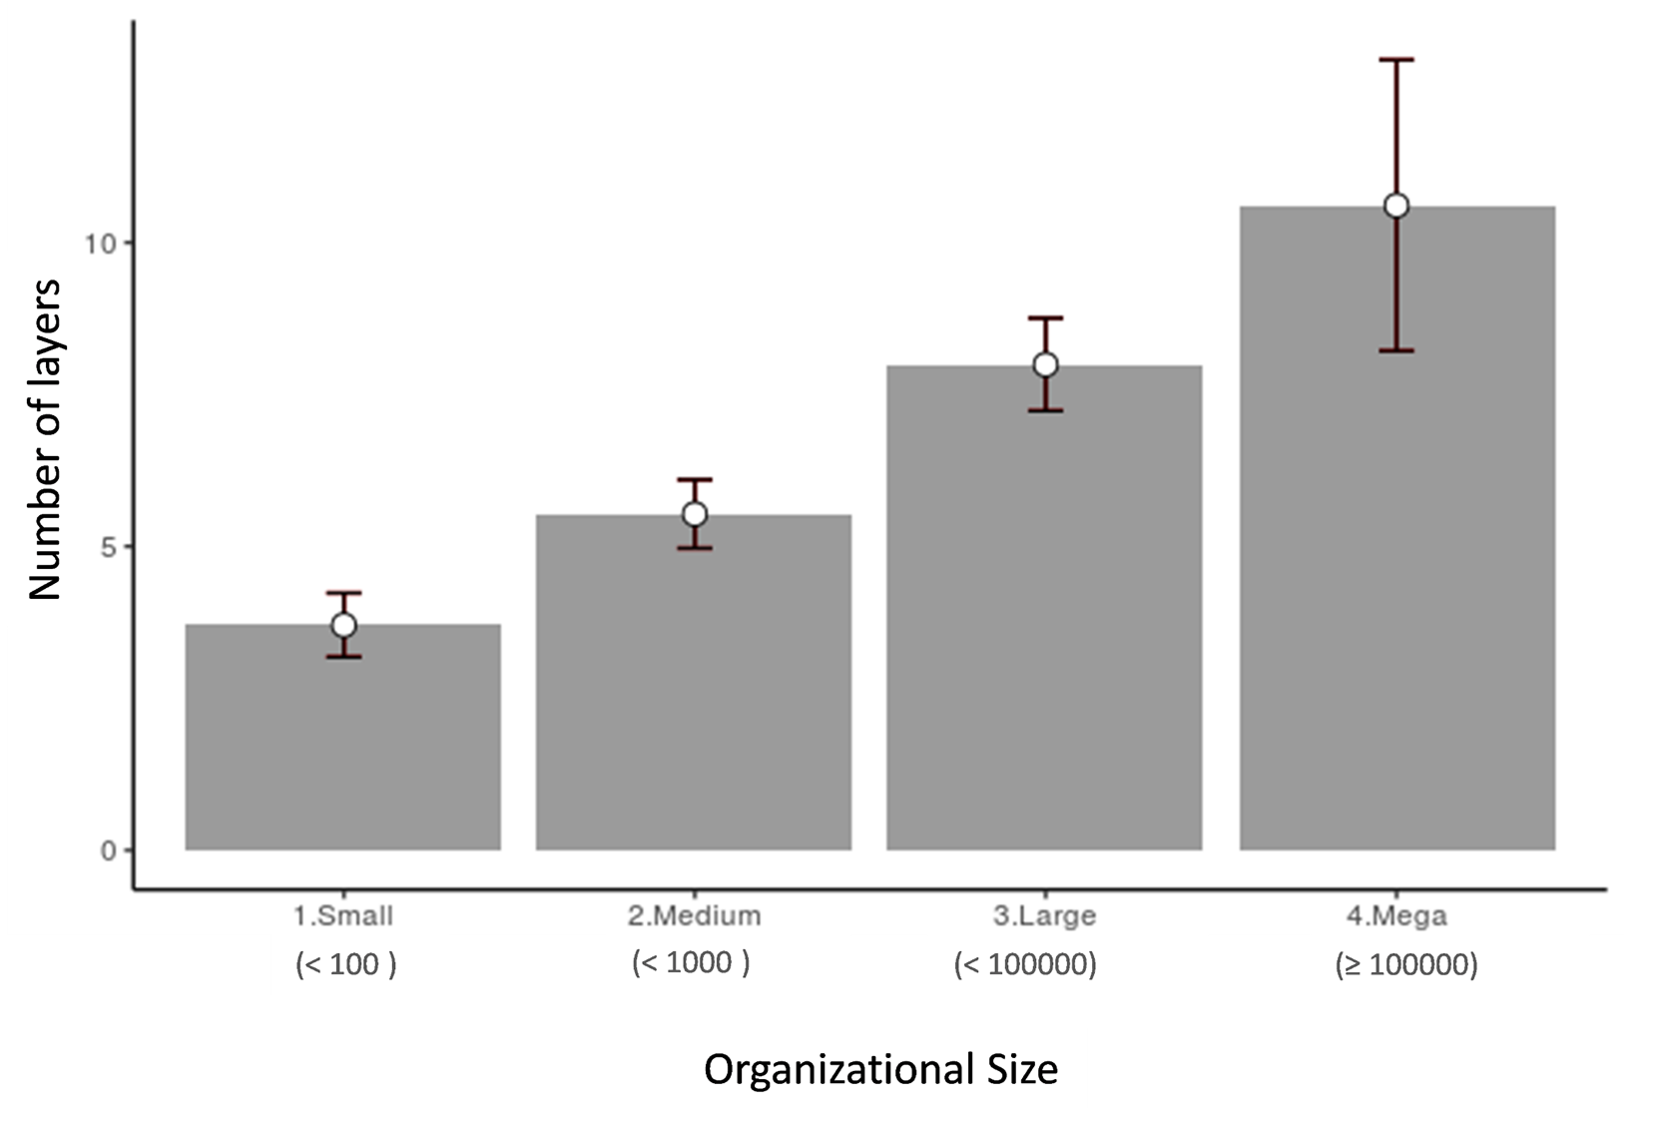
Figure 2.
Q: Which alternative below best describes the relationship between the average span of control (i.e. number of direct subordinates for a boss) and level of that manager in your organization's hierarchy?
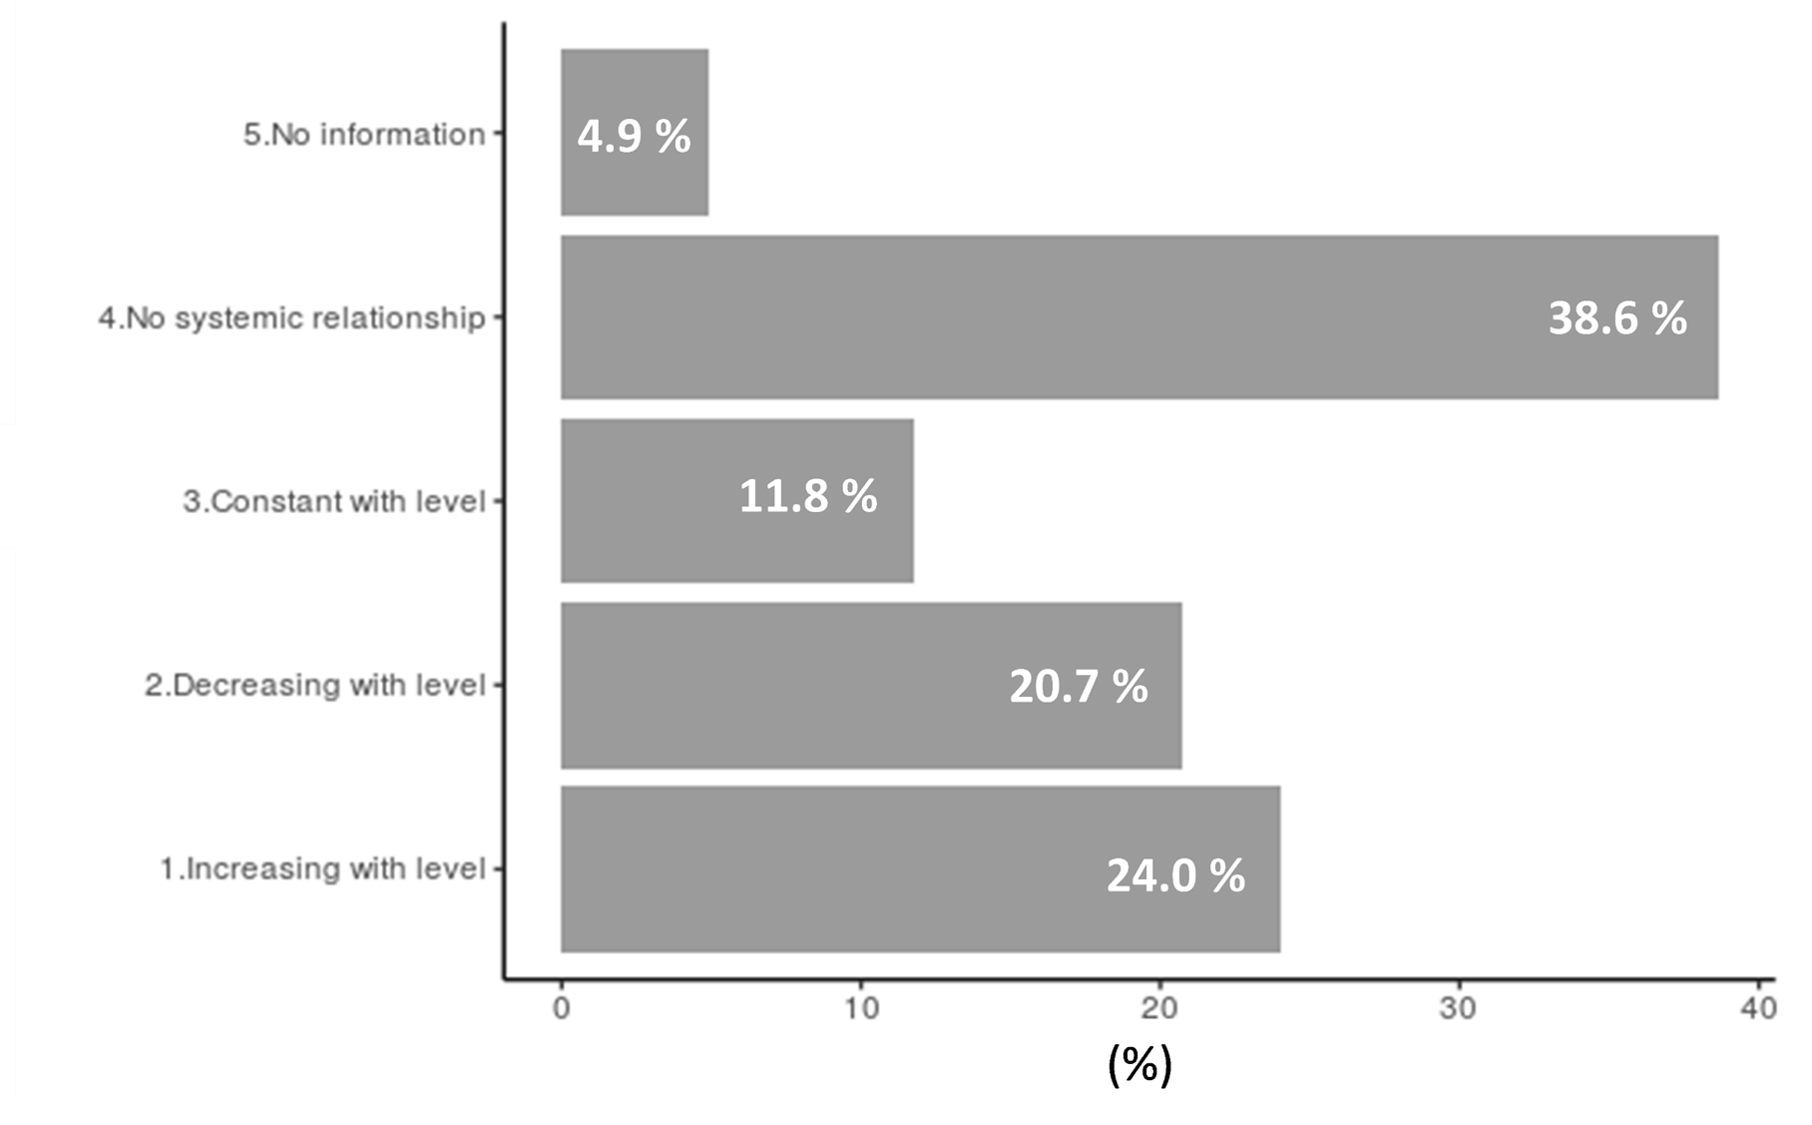
Figure 3.
Q: If you could change ANY of the things below about the shape of your organization's hierarchy, while keeping the number of employees the same, what would they be?
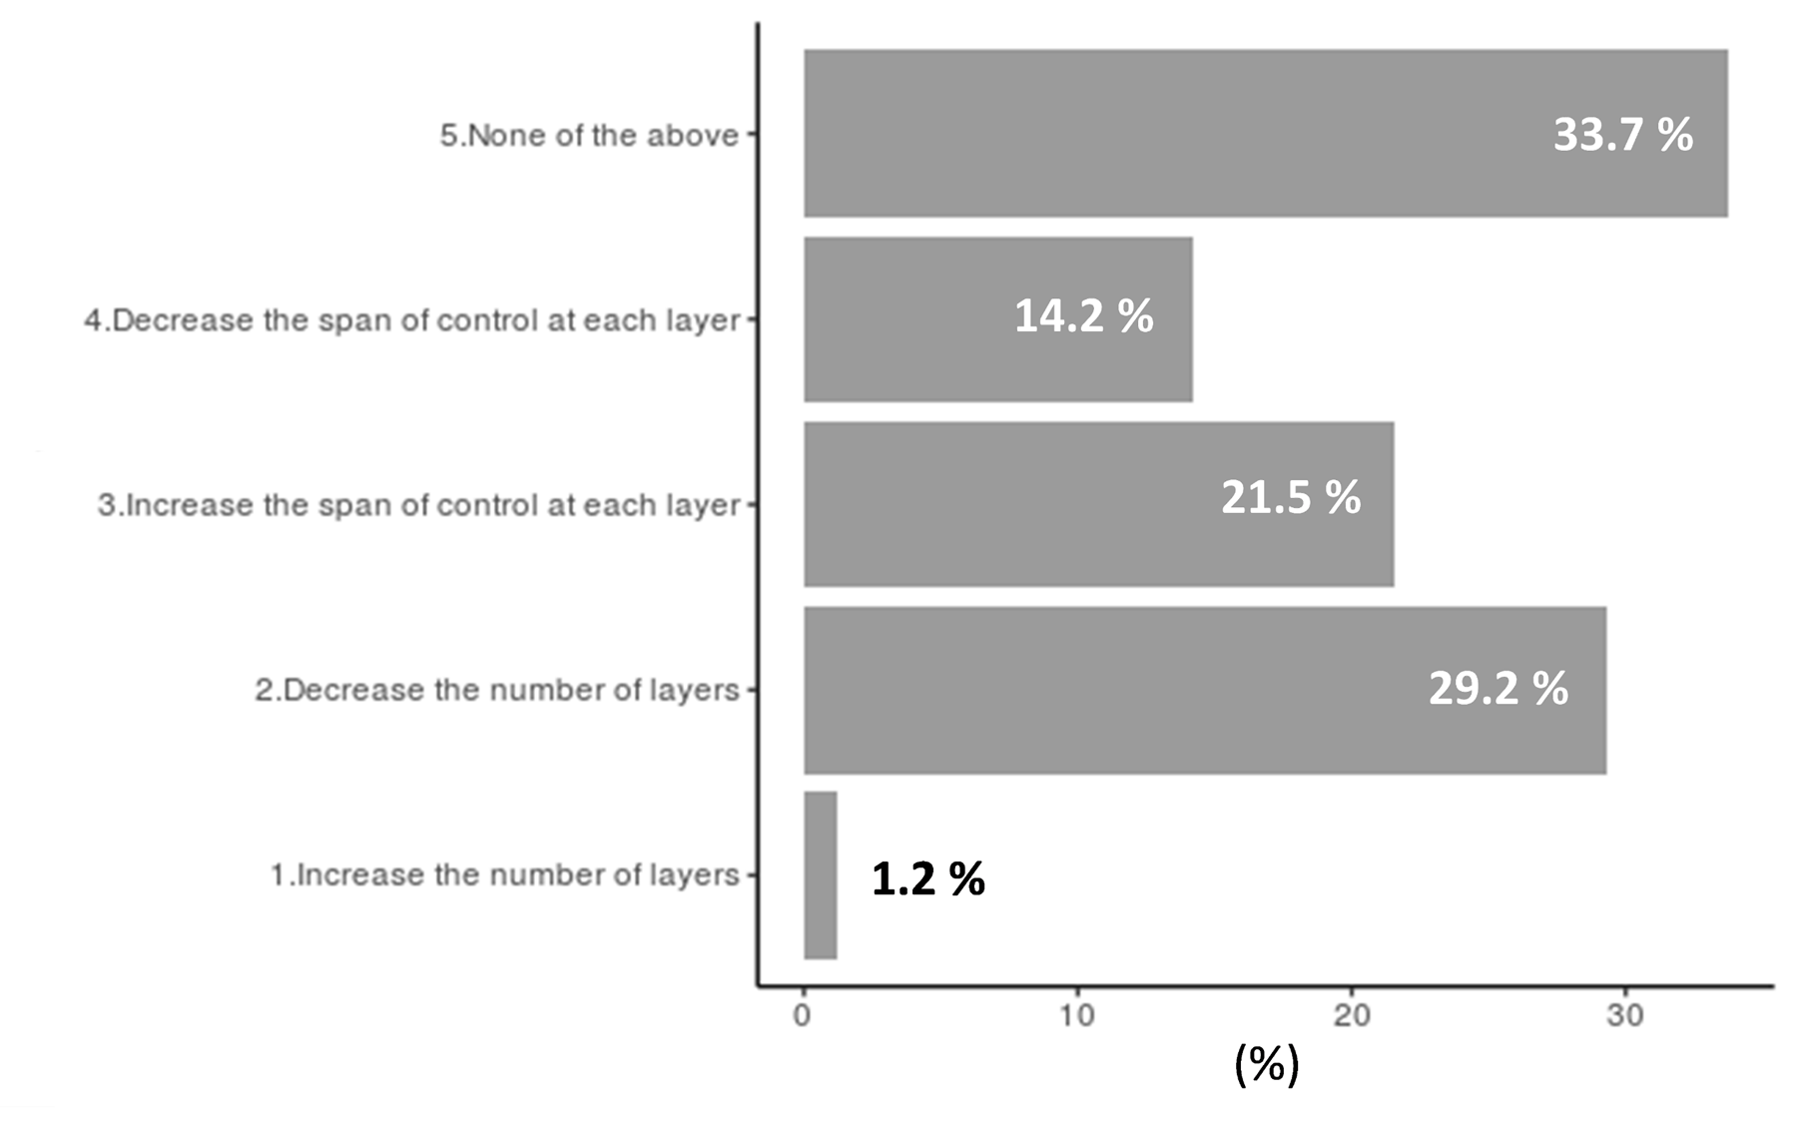
Figure 4. Regional distribution of respondents
*Phanish Puranam is the Roland Berger Chair Professor of Strategy & Organisation Design at INSEAD. He is also the Academic Director of INSEAD’s PhD Programme. Eucman Lee is Assistant Professor in the Division of Strategy, Management and Organisation at Nanyang Technological University.
**Read the full story at knowledge.insead.edu
 By: N. Peter Kramer